How to see every dev server and port on Mac
A Vite app from this morning, an artisan serve from yesterday, Postgres, Redis and whatever your agent started. Here’s how to see all of it, from Terminal or from the menu bar.
By Anmol Sethi · Updated
The quick answer
This lists every TCP port something is listening on, with the program and its PID:
lsof -nP -iTCP -sTCP:LISTENIt shows a snapshot, by program rather than by project. For a live list grouped by project, use a menu bar app like Portlivo (next section), or read on to get the project from Terminal.
The one-click way: Portlivo
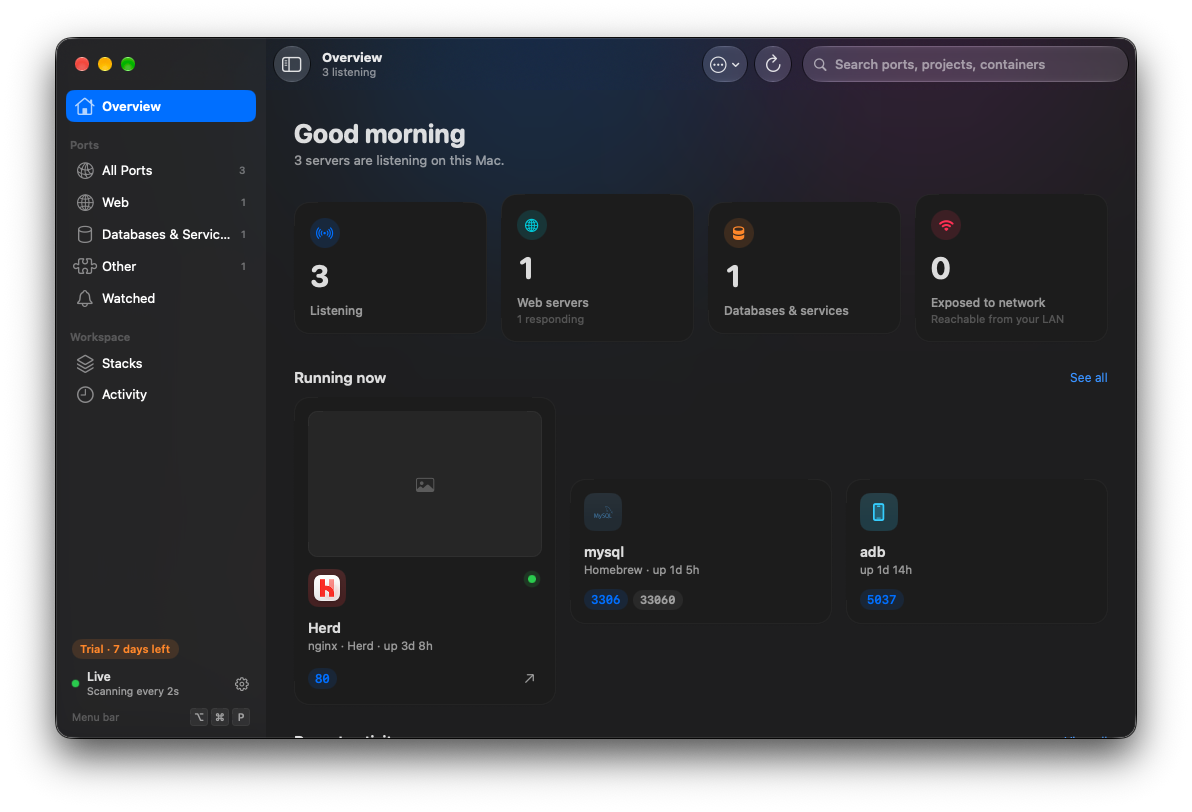
Portlivo turns that lsof output into a list of named servers: project folder, command, uptime, HTTP health, CPU and memory, grouped into web servers and services. It refreshes every two seconds and lives in the menu bar (⌥⌘P from anywhere).
It also marks servers your network can reach, and badges anything started by Claude Code or Codex.
Reading the lsof output
COMMAND     PID USER   FD   TYPE  DEVICE SIZE/OFF NODE NAME
node      48213 you    23u  IPv6  0x8c2f…      0t0  TCP *:3000 (LISTEN)
node      51877 you    24u  IPv4  0x1d07…      0t0  TCP 127.0.0.1:5173 (LISTEN)
php       52210 you     8u  IPv4  0x6b3a…      0t0  TCP 127.0.0.1:8000 (LISTEN)
postgres    611 you     7u  IPv6  0x4e19…      0t0  TCP [::1]:5432 (LISTEN)
redis-ser   702 you     6u  IPv4  0x93c4…      0t0  TCP 127.0.0.1:6379 (LISTEN)
ControlCe 423 you 9u IPv4 0x2f88… 0t0 TCP *:7000 (LISTEN)*:3000accepts connections from other devices on your network;127.0.0.1or[::1]means only this Mac.- Names are cut to nine characters:
redis-seris redis-server, andControlCeis ControlCenter, which is macOS’s AirPlay Receiver on 5000 and 7000. Add+c 0to see full names:lsof -nP +c 0 -iTCP -sTCP:LISTEN. - One server can show twice, once for IPv4 and once for IPv6, with the same PID.
macOS’s netstat shows the same sockets, with PIDs, but is harder to read:
netstat -anv -p tcp | grep LISTENWhich project is it?
lsof shows node or php, not your project. To get the command line and the folder one process runs in:
ps -p <PID> -o command=
lsof -a -p <PID> -d cwd -Fn | sed -n 's/^n//p'
Or for every listening process at once, folder first:
for pid in $(lsof -ti -iTCP -sTCP:LISTEN | sort -u); do
  printf '%s\t%s\n' "$(lsof -a -p "$pid" -d cwd -Fn | sed -n 's/^n//p')" "$(ps -p "$pid" -o command=)"
done
A folder of / usually means a system or app process (an editor helper, for example) rather than a project.
Which servers can other devices reach?
Anything not bound to 127.0.0.1 or [::1] accepts connections from your network, for example a phone on the same Wi-Fi:
lsof -nP -iTCP -sTCP:LISTEN | grep -vE '127\.0\.0\.1|\[::1\]'That’s what you want when testing on a phone, and worth knowing on café Wi-Fi. Most dev servers only listen on localhost unless you pass --host (Vite) or -H 0.0.0.0 (Next.js).
Watch it live
macOS has no watch command, but a loop does the same. Press Ctrl-C to stop:
while true; do clear; lsof -nP -iTCP -sTCP:LISTEN; sleep 2; doneDocker containers and Homebrew services
Ports published by Docker show up in lsof as com.docker.backend (or OrbStack), not as your app. List containers with their ports, and Homebrew services with their state:
docker ps --format '{{.Names}}\t{{.Ports}}'
brew services list
What about Activity Monitor?
Activity Monitor lists processes with CPU and memory, but not the ports they listen on. Double-click a process → Open Files and Ports to see its sockets, one process at a time. Fine for one server, slow for ten.
Found something you want to stop? See how to kill the process on a port.
Try Portlivo free for 7 days. Every feature, no account.
Download for MacStill have a question?
Write to us — a real developer reads every email and replies personally.